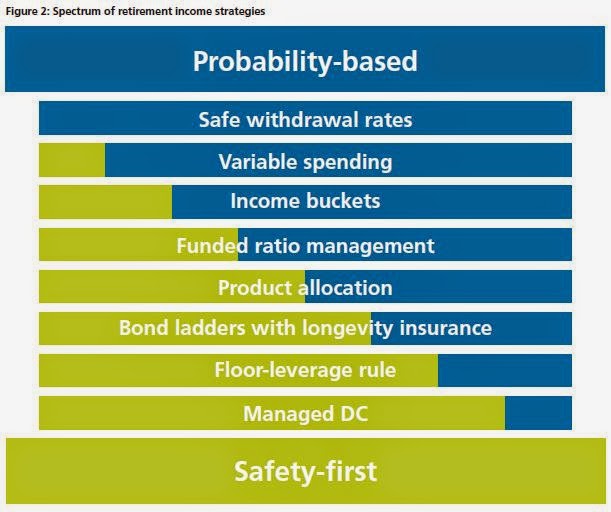
After providing an overview of each approach, we then develop a spectrum to categorize eight different strategies ranging from one extreme to the other. We provide further explanations about these eight strategies:
Retirement income is becoming a bigger deal all around the world. Australia has been very successful on the accumulation side with the mandatory contributions for their superannuation system. As contributors are now reaching retirement with a big pot of assets, the challenge becomes figuring out how to create a sustainable income for life. Challenger is one of the major financial service companies in Australia. And in a way that's different from the United States, Challenger is active in both investment management and insurance, which can allow them to more easily implement strategies on both sides of the spectrum. Since retirement income is still quite a new concept in Australia, this paper is meant to be educational, clarifying how retirement distribution does indeed require different thinking than pre-retirement wealth accumulation.
Outstanding work! Great overview of various withdrawal strategies. I wish an article like this had been available when I retired 6 years ago. I came to similar conclusions about how to allocate assets and withdraw what I needed. You've given me additional things to think about.
ReplyDeleteGotadimple
Thank you Wade for citing 3 of our papers in this great summary. We’ve talked about the below briefly before, so I share the concept for the benefit of your readers to have a deeper insight on the topic you have so well summarized in the paper.
ReplyDeleteTaking the conclusions from those 3 cited papers, I would like to first point out that if 10% of the simulations fail in today’s simulation does NOT translate into the risk that one has a 10% possibility of running out of money at the end of the simulated period. Because, under a Dynamic Updating method, potential income adjustments (illustrated in the SlideShare file that is explained here http://blog.betterfinancialeducation.com/sustainable-retirement/how-does-safe-withdrawal-rate-research-compare-to-dynamic-withdrawals/) would result in money still being available for future spending years. This result is demonstrated in the 4th paper you didn’t cite (Transition Through Old Age in a Dynamic Retirement Distribution Model, Journal of Financial Planning, December 2012, by Larry R Frank Sr, John B Mitchell, and David M. Blanchett.) where multiplying the distribution periods’ withdrawal rate by 1- 1/n continues to extend portfolio balances in combination with any spending adjustments that MAY be needed.
Here’s an example why I say MAY be needed above … which also separates NEEDS and WANTS using the Dynamic Updating method. For example, let’s say that one has a portfolio consisting of 50% cash (no volatility) and 50% equity (has volatility). This retiree could evaluate their portfolio’s standard deviation – for example 50% decline equates to 3 standard deviations (99.7% of the time the values MAY reach this point). This is a low possibility and with the above simplified example, would mean that the volatile part of the portfolio of 50% equity may decline by 50% (3 Std Dev) = a total equity value decline in this event being 25% [this simple example for illustration purposes]; and thus the total portfolio may retain 75% of its value [the 50% cash portion would not change value to simplify this example].
Thus, in this simplified example, 99.7 percent of the time 75% of the portfolio’s income could be thought of as being allocated to the NEEDS expenses of the retiree, while the 25% of the portfolio’s income could be thought of as being allocated to varying degrees (1, 2 or 3 standard deviations) of WANTS by the retiree; wants being those expenses the retiree may choose to cut back on in the various standard deviation scenarios they've evaluated AHEAD OF TIME).
This example shows that some of the invested income sources of retirees can also be allocated towards retiree NEEDS expenses over and above Social Security, Pensions, annuity, etc. income sources. I bring this up because there’s a mental shortcut often taken by some suggesting that ALL of the invested income sources have to be in the WANTS category because ALL of the invested portfolio is viewed as volatile. A large percentage of portfolio income potential from most properly structured portfolio allocations are not volatile – the exposure to volatility may be evaluated to a degree by standard deviation. A retiree may look at their specific portfolio standard deviation and evaluate the degree of their expenditure exposure to potential changes, by degree of portfolio decline likelihood that fall within the standard deviation range, to see what the degree of portfolio decline they may experience with their own numbers. My example was simple to explain the concept, however, once understood the concept applies to any portfolio allocation.
Thanks Wade, for a great summary paper that takes on a different comparison than before.
TABLE 1 - NEW CHALLLENGES summary really nails it...Sam Pittsburgh
ReplyDelete